"B1.lt graphs" — financial analytics
How B1.lt graphs works
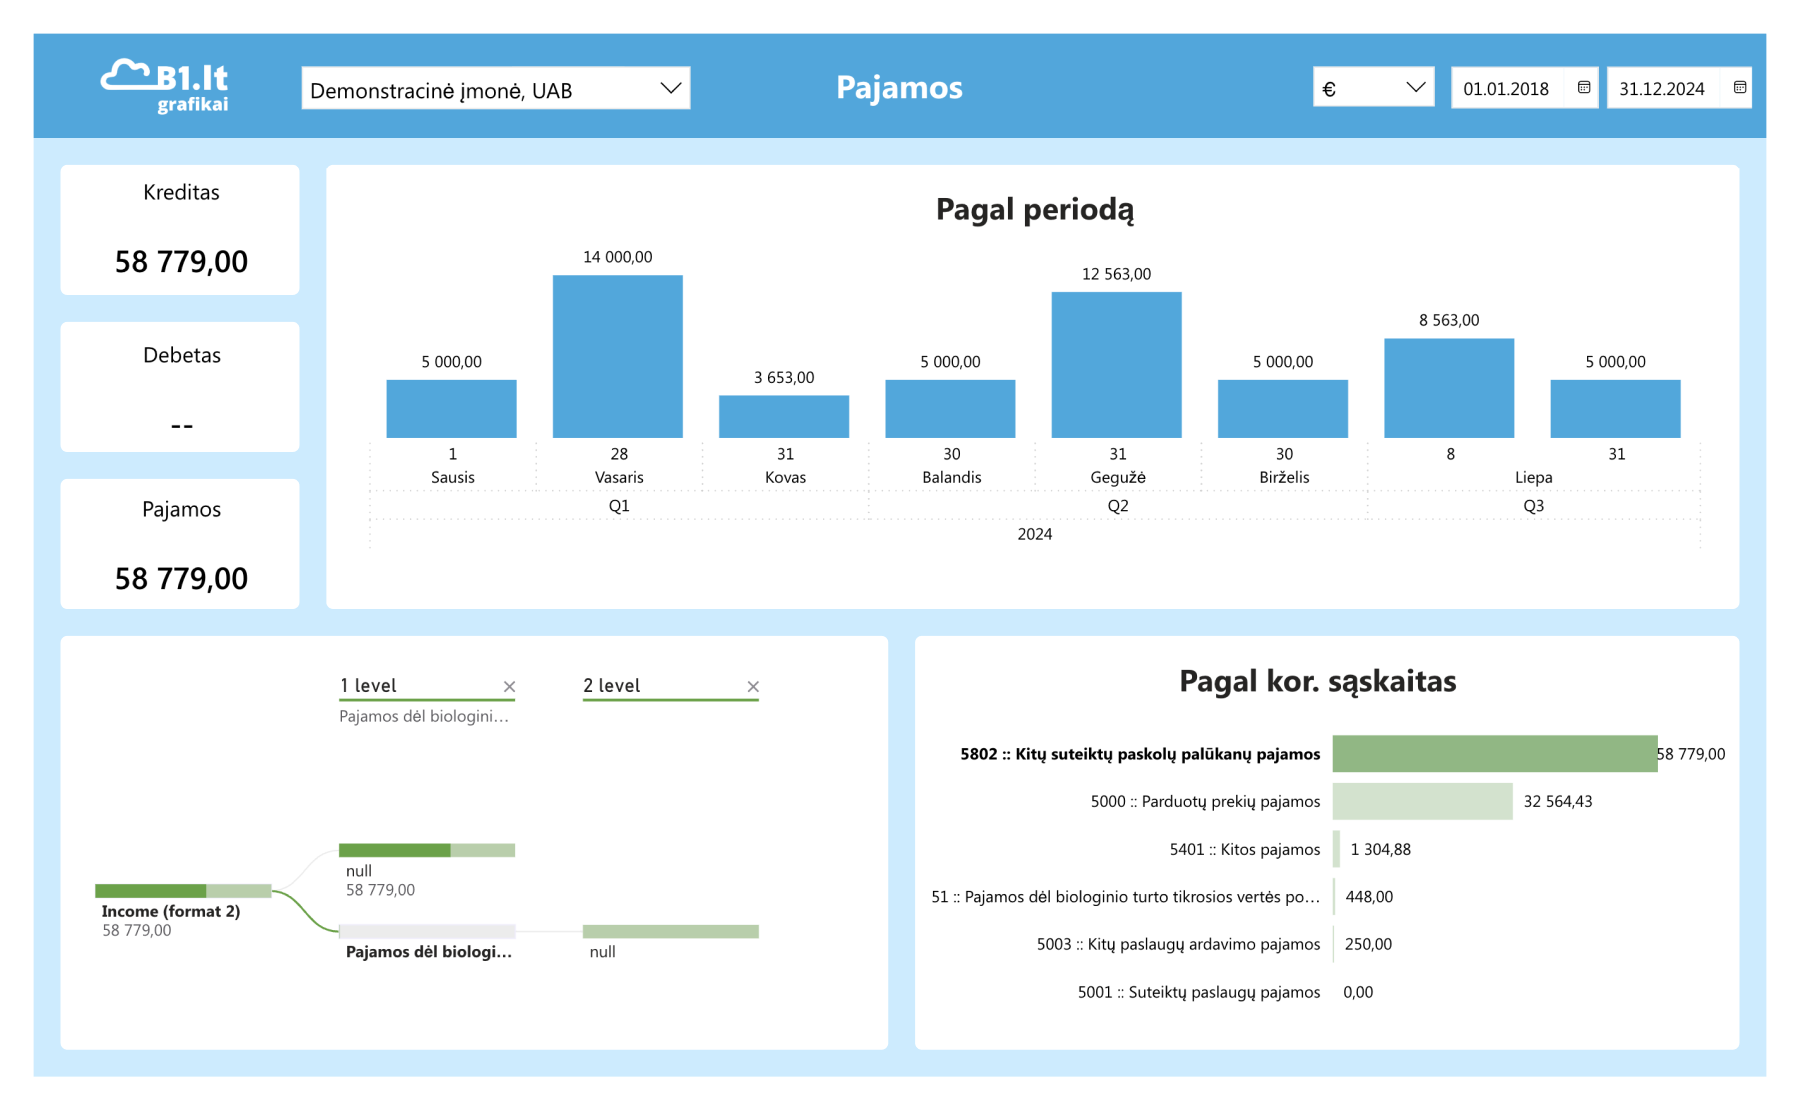
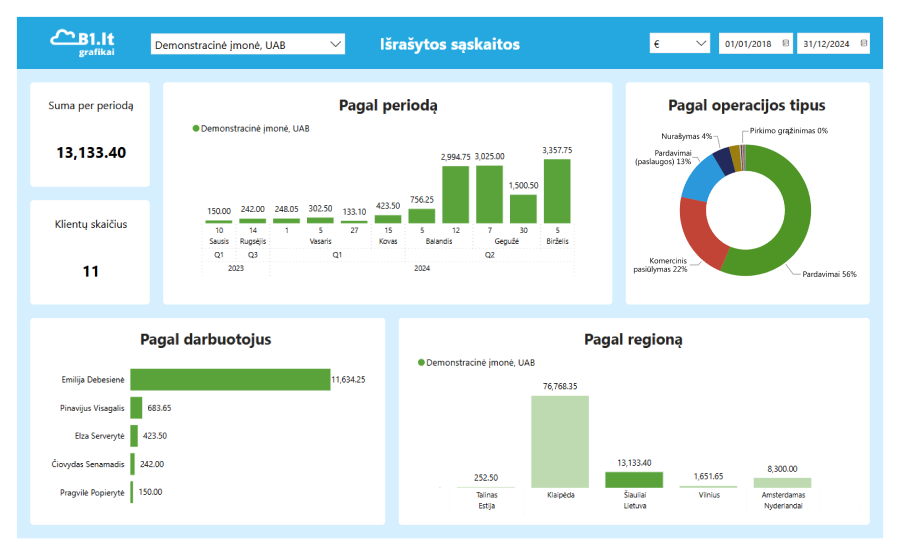
The „B1.lt graphs“ solution allows you to see B1.lt data on the modern Power BI platform without any programming. This solution is designed to simplify the data analysis process and facilitate business decision-making. With just a few clicks, you can activate the integration according to your company's accounting data.
How to activate
- Add "B1.lt graphs" to „Power BI“.
- Create an API key if you haven't already.
- Enter the required login details and enjoy the graphs.
Notes
- The first time the integration is activated, the number of API requests may be higher because all information up to yesterday is taken, only updates are sent afterwards.

How much will integration with B1.lt cost?
(prices shown per month excluding VAT)
65€ / mth.
- 3€/mth. — company accounting database;
- 12€/mth. — user plan "Minimal" or higher;
- 50€/mth. — integration with a unlimited number of warehouses (how to connect several).
You can enjoy the following benefits with the "B1.lt graphs" app:
- working with several companies at the same time;
- integration of data from your company's data sources;
- accessibility from any device;
- interactive data presentation;
- easy link sharing and working with unlimited number of employees.